Market Update - Corona Virus - February 25, 2020
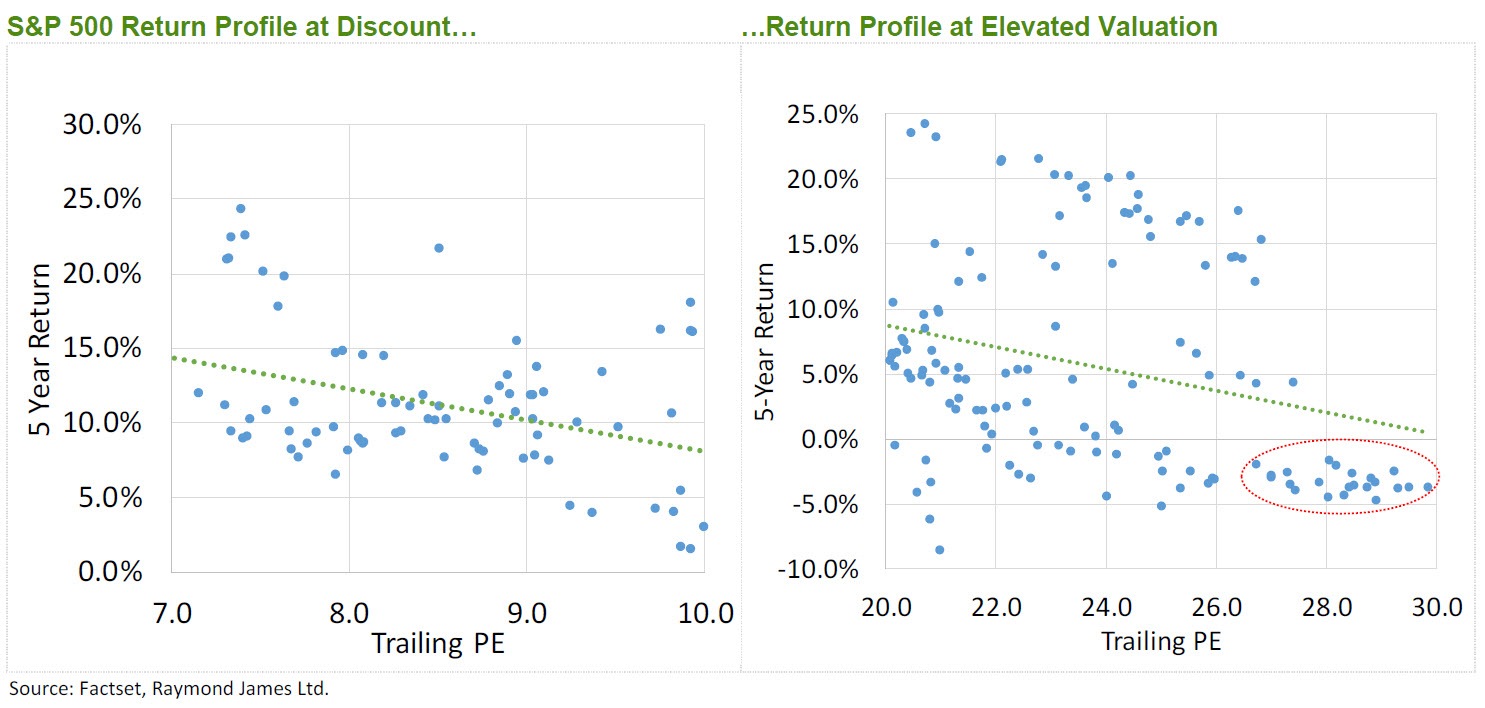
The novel coronavirus has introduced a new level of uncertainty into the market just as the global economy began showing signs of a recovery. However, we need to put this pullback into perspective. The US and Canadian markets have continually advanced without a 10% correction for over 14 months; the market was overdue for some sort of weakness as upside momentum was just unsustainable. Simply annualizing the S&P/TSX return YTD (prior to this week’s correction) would mean the one year return would equal 40%! Considering valuation measures, the Canadian market trades near its historical average, which gives our market somewhat of a buffer, while the US market has become frothy. We discussed this in our February Insights & Strategies: Value is What You Get; an investor who places capital at work when the market is trading at or above 20x trailing earnings can experience a midsingle digit annualized return over a 5-year period, which is a reasonable outcome.However, the chances of a positive return outcome are only 66% and the investor will also experience greater volatility in returns, when compared to investing below this valuation level. Simply put, investing in the equity market at elevated valuation levels becomes trickier and investors must be aware of the potential risks. In the right hand chart below, we can also see a clustering of data points (red circle) in the lower right quadrant highlighting the negative outcomes that can occur when one invests near peak valuation.
The ultimate impact from coronavirus is unknown, but we know that Q1/20 GDP growth will take a hit. If past epidemics are any indication, this slump in growth will be temporary. The best road map we can use is severe acute respiratory syndrome (or SARS) in 2003. When the SARS epidemic was at its worst, Chinese economic growth slowed significantly. In the second quarter of 2003, the country’s year-over-year GDP growth slumped to 9.1% from 11.1% in the prior quarter; however, growth eventually rebounded to 10% in the final two quarters of the year. With the spread in new coronavirus cases reportedly slowing in China, it’s possible that we’ll see a similar pattern where growth will slow significantly in Q1, but rebound in later quarters. The Chinese economy is larger today than in 2003 and the level of integration within the global supply chain has also expanded, which will have a negative impact on 2020 global GDP growth. Current projections suggest the outbreak will peak in the coming months. As such, the one-time hit to growth should reverse in the back-half of 2020.
While this week’s volatility can be unsettling, it’s a reminder that equity markets can quickly move in either direction. It also reminds us of a common behavioural mistake investors often make – anchoring. This is a behavioural bias where an investor becomes psychologically fixated on a particular price level when making investment decisions. For example an investor, after this week’s volatility, may feel they have experienced a loss. However, the only investor that experienced a loss this week are those that actually placed all their capital in the equity markets on February 20th. For the vast majority of investors, this is not the case. Let’s consider two scenarios: an investor that placed capital into the S&P/TSX at the peak and another that invested at the low of 2018. If you invested during the summer of 2018, you’ve experienced a price return of ~6%, which is very close to the historical annualized return of the S&P/TSX. For those that invested at the 2018 low in December, you’ve gained a whopping 28%!So while the markets are off from the February 20th level, clearly investors that are focused on the long game have experienced a positive return.
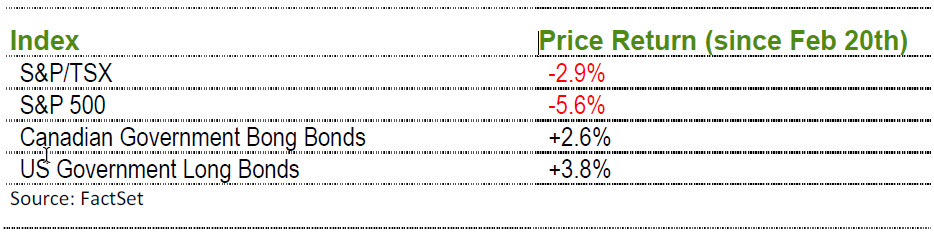
Nonetheless, this week’s volatility can be unsettling and is a reminder that equity markets are inherently volatile. It’s also a reminder that when we’re investing for long-term goals, asset allocation is an important element in the investment process. Simply consider the last few days of trading; the Canadian and US markets have slipped while fixed income markets have advanced. An investor with a 60/40 allocation to Canadian equities and bonds would have only experienced a loss of 0.7%, significantly less volatile when compared to an equity-only portfolio. In this case, bonds did their job during a period of risk-off behaviour. We remind clients to stick to their plan, but also to revisit their asset allocation to ensure they are comfortable with the inherent risk/reward profile of your existing asset mix.
In the days ahead, we will continue to receive headlines related to the spread of the novel coronavirus, which will increase equity market volatility. However, looking long term, the overriding positive theme for equities remains intact and, by and of itself,the setback is likely a temporary interruption of the upward momentum. The world’s largest economy, the US, continues to grow, the job market and consumer remain strong, and the Fed is fully committed to supporting risk assets through monetary policy. These temporary setbacks can create good opportunities within the market, as such, we will be looking for evidence this corrective phase has run its course and the market finds a firm footing.
During periods of volatility, it’s important to take a step back and look at the bigger picture. Equity markets are prone to corrections and can even temporarily slip into bear markets within the context of a secular bull market. Not that we’re even close to a bear market, but we like to remind investors of the historical context of market cycles:
- Bear markets tend to be shorter in duration and magnitude than bull markets;
- Bull markets always follow bear markets, with equity prices recovering from previous downturns; and
- Over the long run, equities provide investors with solid returns, enabling investors to achieve their financial goals.
These points are illustrated in the chart below. Note how the bear markets (in red) ares hallow in duration and magnitude relative to bull markets (in green), and note the long-term upward trend of the S&P/TSX. While the S&P/TSX goes through these up and down cycles, over the long run, it has returned roughly 7.5%, including dividends,per year since the 1980s.


![]()
